RESEARCH ARTICLE
A Fast Algorithm for the Demosaicing Problem Concerning the Bayer Pattern
Antonio Boccuto1, Ivan Gerace1, *, Valentina Giorgetti1, 2, Matteo Rinaldi1
Article Information
Identifiers and Pagination:
Year: 2019Volume: 6
First Page: 1
Last Page: 14
Publisher Id: TOSIGPJ-6-1
DOI: 10.2174/1876825301906010001
Article History:
Received Date: 29/6/2018Revision Received Date: 6/12/2018
Acceptance Date: 18/12/2018
Electronic publication date: 29/1/2019
Collection year: 2019
open-access license: This is an open access article distributed under the terms of the Creative Commons Attribution 4.0 International Public License (CC-BY 4.0), a copy of which is available at: https://creativecommons.org/licenses/by/4.0/legalcode. This license permits unrestricted use, distribution, and reproduction in any medium, provided the original author and source are credited.
Abstract
Introduction:
In this paper, we deal with the demosaicing problem when the Bayer pattern is used. We propose a fast heuristic algorithm, consisting of three parts.
Methods:
In the first one, we initialize the green channel by means of an edge-directed and weighted average technique. In the second part, the red and blue channels are updated, thanks to an equality constraint on the second derivatives. The third part consists of a constant-hue-based interpolation.
Results:
We show experimentally how the proposed algorithm gives in mean better reconstructions than more computationally expensive algorithms.
1. INTRODUCTION
The demosaicing problem is related to the acquisition of RGB color images by means of CCD digital cameras. In the RGB model, each pixel of a digital color image is associated to a triple of numbers, which indicate the light intensity of the red, green and blue channel, respectively. However, most cameras use a single sensor, associated with a color filter that allows only the measure at each pixel of the reflectance of the scene at one of the three colors, according to a given scheme or pattern, called Color Filter Array (CFA). For this reason, at each pixel, the other two missing colors should be estimated. Different CFA’s are proposed for the acquisition [1-3]. The most common is the Bayer pattern [4]. In this scheme, the numbers of pixels in which the green color is sampled are double with respect to those associated with the red and blue channels, because of the higher sensibility of the human eye to the green wavelengths. If we decompose the acquired image into three channels, we obtain three downsampled grayscale images, so that demosaicing could be interpreted as interpolating grayscale images from sparse data. In most cameras, demosaicing is a part of the processing required to obtain a visible images. The camera’s built-in-firmware is substantially based on fast local interpolation algorithms.
The heuristic approaches, which do not try to solve an optimization problem defined in mathematical terms, are widely used in the literature. These methods, in general, are very fast. Our proposed technique is of heuristic kind. In general, the heuristic techniques consist of filtering operations, which are formulated by means of suitable observations on color images. The nonadaptive algorithms, among which bilinear and bicubic interpolation, yield satisfactory results in smooth regions of an image, but they can fail in textured or edge areas. Edge-directed interpolation is an adaptive approach, where, by ana-lyzing the area around each pixel, we choose the possible interpolation direction. In practice, the interpolation direction is chosen to avoid interpolating across the edges. In [5], for each pixel the horizontal and vertical gradients are compared with a constant threshold. If the gradient in one direction is greater than the threshold, then interpolation is not performed along this direction. Some other direct interpolation methods use larger neighborhoods by examining different color channels. In [6], to determine the edges of the green channels, the red and blue channels are employed. On the other hand, to determine the edges of the red and blue channels, some discrete derivation operators of the second order are used, while in [7], to determine the edges in the various channels, a suitable Jacobian operator is applied. In [8], local homogeneity is used as an indicator to choose horizontally or vertically interpolated intensities. Thanks to homogeneity-directed interpolation, the luminance and chrominance values have to be similar in a suitable neighborhood. In demosaicing it is often assumed that the differences or the ratios of the intensity values in different channels are locally constant [5, 6, 9-14]. In [11] the probability of having an edge in a certain direction is determined and used to find the weights relative to the weighted average employed as an interpolation operator. In this algorithm, the color channels are updated iteratively according to the constant color ratio condition. In [15] a similar algorithm is proposed, where -size neighborhoods are employed to find the edges of the green channel, and -size neighborhoods are used to determine the edges of the red and blue channels. An analogous algorithm is defined in [16], where the interpolation can be done also in the diagonal direction, while in [17] the weighted directional interpolation is used by means of a fuzzy membership assignment. A second order operator is employed as a correction term. [18]
To have more accurate results, several techniques, which use iterative methods, are proposed. However, they have a higher computational cost with respect to the heuristic techniques. One of well-known techniques is the algorithm of Alternate Projections (AP) [19], which uses the strong correlation between the high frequences of the three colored components, by projecting alternately the estimated image in a constraint of observation and in a constraint which imposes similarity between the red and green edges and between the blue and green edges, until a fixed point is found. Another widely used technique is regularization [20, 21]. The algorithm is based on interpolation in a residual domain [22]. The residuals are the differences between the observed and estimated pixel values which minimize a Laplacian energy.
The algorithm here presented consists of three steps. The first two ones are initialization steps, while the third one is an iterative steps. In the first one, the missing valued in the green component are determined, in particular a weighted average-type technique is used. The weights are determined in an edge-directed approach, in which we consider also the possible edges in the red and blue components. In the second step, we determine the missing values in the red and blue components. In this case we use two alternative techniques, according to the position of the involved pixel in the Bayer pattern. In the first technique, the missing value is determined by imposing that the second derivative of the intensity value of the red/blue channel is equal to the second derivative of the intensity values of the green channel. This is done according to the proposed approaches in the AP algorithm and the regularization algorithm given in [20]. In particular, a constraint is imposed, to make the derivatives of all channels similar as soon as possible [20]. At the third step, all values of the three channels are recursively updated, by means of a constant-hue-based technique. In particular, we assume the constant color difference. The technique we propose at this step is similar to that used by W. T. Freeman [10]. Indeed, even here a median filter is employed, in order to correct small spurious imperfections. We repeat iteratively the third step. However, to avoid increasing excessively the computational cost, we experimentally estimate that only four iterations are necessary to obtain an accurate demosaicing. We call our technique as Local Edge Preserving (LEP) algorithm.
The paper is structured as follows. In Section 2 we give a mathematical formulation of the demosaicing problem. In Section 3 we describe the initialization of the proposed algorithm, which consists of the two first steps aforementioned. In Section 4 we give the third iterative step of our algorithm, highlighting the differences with the Freeman filter. In Section 5 our experimental results are presented. This section consists of two parts. In the first one, we determine the best detection function which can be used in order to evaluate the edges. In the second one, we compare our algorithm with some other techniques recently proposed in the literature and we show how the LEP method gives in mean more accurate reconstructions than the other considered algorithms.
2. THE DEMOSAICING PROBLEM
An RGB (Red-Green-Blue) color image with height n and width m is a vector of the type
 |
where  are the red, green and blue channels according to the lexicographic order, respectively. We consider the problem of acquisition of data from a digital camera, and call it "mosaicing problem". Given an ideal image
  , the acquired or "mosaiced image" is defined by
 |
where  and
and  is a linear operator defined by setting
 |
 is the null matrix, and
  are diagonal matrices whose principal entries, if we use the Bayer pattern Fig. 1, are given by
 |
where the symbol  indicates that i-j is even. The corresponding demosaicing problem is the associated inverse problem, that is to determine the ideal color image x, knowing the mosaiced image
  and the linear operator M. An inverse problem is said to be well-posed (in the sense of Hadamard) if and only if the solution exists, is unique and stable with respect to data variation. A not well-posed problem is said to be ill-posed [23]. Note that the demosaicing problem is ill-posed, since the matrix M in (2) is singular, as it is readily seen, and so there are infinitely many solutions.
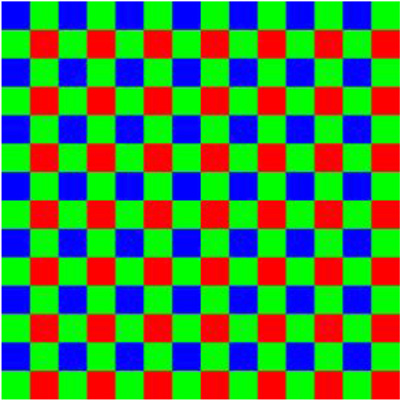 |
Fig. (1). Bayer pattern. |
3. THE INITIALIZATION OF THE PROPOSED ALGORITHM
In the initialization phase we proceed as follows: first we initialize the green channel, since in this channel we have more data than in the other ones, and successively we update the other two.
3.1. The Initialization of the Green Channel
We refer to a clique as a pair of adjacent pixels. Every missing value of the green channel is initialized by a weighted mean of the known green values in its neighborhood. The weights of the considered mean take into account possible discontinuities in a set of adjacent cliques. We consider cliques both in the blue and in the red channel, since it is well-known that there is a correlation between the discontinuities in the various channels related to edges, such as object borders and textures [11]. Here we distinguish three cases: the first one is when we have the value of the green light intensity on a pixel; the second one is when we the blue value of the involved pixel is known, that is when i and j are both odd; the third one is when the red value on the considered pixel is known, namely when i and j are both even.
The first approximation g(0) of the green ideal image g is given by
 |
Note that, in the first case, we keep the value we already have. In the second case, we do a weighted mean of the intensity values taken on the adjacent pixels where the green value is known. The weights t1, t2, t3, t4 of the mean are computed by using the green and the blue channels. We define
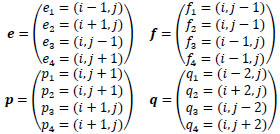 |
(1) |
In particular, we get
 |
(2) |
where k = 1, 2, 3, 4, ϕ is a suitable positive decreasing detection function and τk is defined by
 |
and the pixels ek, fk, pkand qk are as in (1). When the differences between the green values on the pixels ek and fk (see the yellow arc in Fig. (2) for k = 1), and pk (see the cyan arc in Fig. (2) for k = 1), and between the blue values on the pixels (i, j)and qk (see the brown arc in Fig. (2) for k = 1) are small enough, then we can assume that there are no discontinuities between the pixels ek and (i, j) (see the red line in Fig. (2) for k = 1). So, in the calculus of the green value on the pixel (i, j), we give a large weight t1 to the green value in the position ek. Thus, when the value τk is small, the probability of having a discontinuity between the pixels (i, j) and ek in the green channel is large, and vice versa. The computation of τk is illustrated in Fig. (2). For k = 1, 2, 3 the computation of τk can be described by an appropriately rotated similar figure.
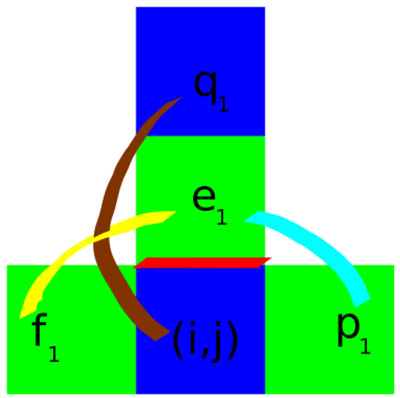 |
Fig. (2). Computation of for τk for k = 1. |
Even in the third case, we compute the weighted mean of the intensity values taken on the adjacent pixels where the green value is known. The weights t4+k, k = 1, 2, 3, 4 of the mean are computed by using the green and the red channels. In particular, t4+k = ϕ (τ4+k), where
 |
and ek, fk, pk and qk are as in (1). We argue analogously as in the computation of the weight tk, k = 1, 2, 3, 4, where the role of the blue channel is played by the red component.
3.2. The Initialization of the Red Values
Here we distinguish four cases: the first one is when we already know the red value of a pixel; the second one is when we know the red values in the two adjacent pixels in the same column, that is i is odd and j is even (Fig. 3a); the third one is when we know the red values in the two adjacent pixels in the same row, namely i is even and j is odd (Fig. 3b); the fourth one is when we know the red values of the pixels adjacent in the corners of the involved pixel, that is i and j are both odd (Fig. 3c). In the second and in the third case we equalize the second derivatives of the red and the green channels previously computed. In the last case we use the computed values of the red channel to determine the weights of a suitable mean.
So, we define the initial estimate r(0) of the red ideal image r by
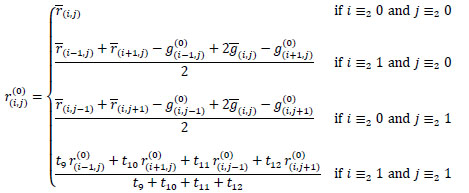 |
Note that, in the first case, we keep the value which we already have. In the second case, we pose that the finite difference of the second order in the vertical direction of the red channel coincides with that of the green channel, which we have already initialized, namely
 |
(3) |
Since we know  , we can deduce the value of
  from (3).
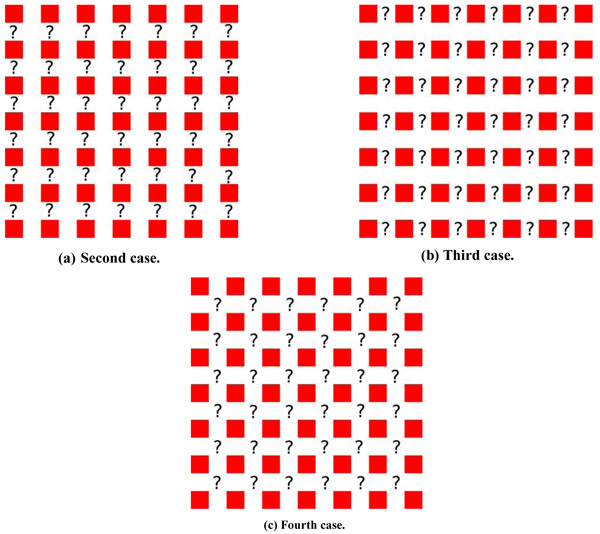 |
Fig. (3). Different cases in the initialization of the red channel. |
In the third case, we impose that the finite difference of the second order in the horizontal direction of the red channel coincides with that of the green channel, just already initialized, that is
 |
(4) |
By proceeding analogously as above, we obtain the value of  from (4).
In the fourth case, we do a weighted mean of the intensity values taken on the adjacent pixels where the red value has just been computed. The weights t8+k, k = 1, 2, 3, 4, of the mean are calculated by using the just initialized red channel and the observed blue channel. In particular, t8+k is given by ϕ(τ8+k), k = 1, 2, 3, 4, where ϕ is the detection function used in initializing the green channel, and
 |
where ek, fk, pkand qk are as in (1). When the differences between the red values on the pixels ek and fk, ek and pk, and between the blue values on the pixels (i, j) and qk, are sufficiently small, then we can suppose that there are no edges between the pixels (i, j) and ek. So, in the calculus of the red value on the pixel (i, j), we have a large weight t8+k, k = 1, 2, 3, 4, in correspondence with the red value in the position ek.
3.3. The Initialization of the Blue Values
Also in this setting, we distinguish four cases: the first one is given when we know the blue value of a pixel; the second one is when we know the blue values in the two adjacent pixels in the same column, that is i is even and j is odd (Fig. 4a); the third one is when we know the blue values in the two adjacent pixels in the same row, namely i is odd and j is even (Fig. 4b); the fourth one is when we know the blue values of the pixels adjacent in the corners of the involved pixel, that is i and j are both even (Fig. 4c). In the second and third cases we equalize the second derivatives of the blue and the green channels previously calculated. In the last case we use the computed values of the blue channel to determine the weights of a suitable mean.
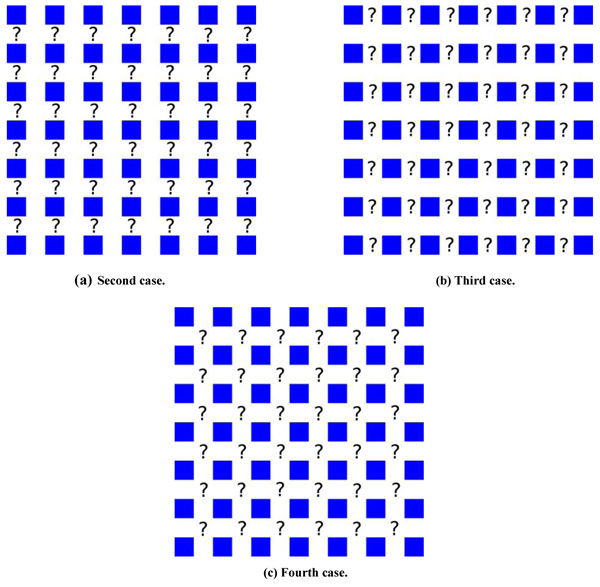 |
Fig. (4). Different cases in the initialization of the blue channel. |
Thus, we define the estimate b(0) of the blue ideal image b by
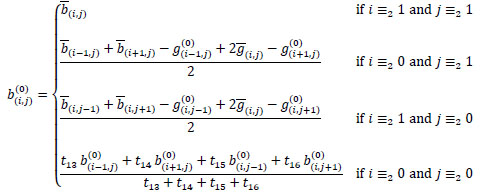 |
Note that, in the first case, we keep the value which we already have.
In the second case, analogously as before, we impose
 |
(5) |
As we know  , we derive the value of
  from (5).
In the third case, similarly as above, we get
 |
(6) |
By arguing as in the previous section, we deduce the value of  from (6).
In the fourth case, we do a weighted mean of the intensity values of the adjacent pixels where the blue value has just been computed. The weights t12+k, k = 1, 2, 3, 4, of the mean are calculated by using the observed red channel and the just initialized blue channel.
Analogously as before, we obtain t12+k = ϕ (τ12+k), where
 |
where ek, fk, pkand qk are as in (1).
4. THE ITERATIVE PHASE OF THE PROPOSED ALGORITHM
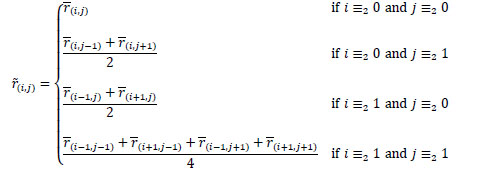
A classical filter, often used to solve the demosaicing problem, is the Freeman filter also [10]. The phase described in this section is a suitable modification of this filter. The Freeman filter performes the initialization phase by means of the bilinear filter, which works as follows. When the value of a certain color of a pixel is not available, such a value is computed by the arithmetic mean of the values of that color, which are assumed in the neighborhood of this pixel, that is the bilinear estimation is given as
 |
 |
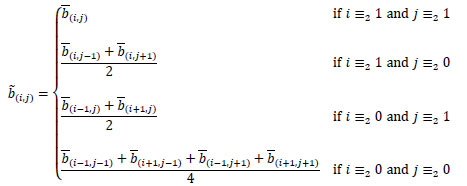 |
Moreover, the following values are defined, by means of the median of the color differences of the channels red-green and blue-green [10]:
 |
where
 |
(7) |
with  . The median turns out to be very useful to correctly preserve the edges which are in the images. Indeed, the median filter is often used to restore images corrupted by salt-and-pepper noise, namely by the noise present only in a few pixels not adjacent each other.
In the Freeman filter it is assumed that the color differences are constant in a suitable subarea. Thus, the Freeman estimation is defined as follows:
 |
 |
 |
In this paper we modify the Freeman filter as follows.
From the initial estimation  we define the following variables:
 |
 |
 |
where  . So, we define the estimates
  for s = 1, 2,... as follows:
 |
 |
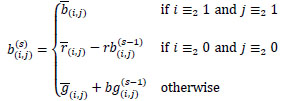 |
We pose our final estimate as
 |
We saw experimentally that a good approximation is given by  . We call the technique associated to this estimate as Local Edge Preserving (LEP) algorithm.
5. EXPERIMENTAL RESULTS AND DISCUSSION
In this section we present the experimental results obtained from the implementation of the proposed algorithm, which was tested for the Bayer CFA on the set of Kodak sample images [24], of size, shown in Fig. (5). This dataset represents the typical benchmark images used in the literature to compare the various demosaicing algorithms. These high quality images have been acquired as raw images, in order to minimize the compression. We have implemented our algorithm in the C language on an Ubuntu operating system by means of a computer having a processor of speed of 3.40 GHz.
To define a specific LEP method, we assume that the radius t of the neighborhood of the median filter in the equation (7) is equal to, and we experimentally choose the detection function  in (2). In particular, the tested functions are
 |
 |
 |
Observe that the detection functions ϕj, j = 1,...,6 are decreasing and continuous. Moreover, we get ϕj(0) = 2 and  .
.
In Table 1 there are the errors of the LEP algorithm in terms of Mean Square Error MSE, also [20] in reconstructing the images of the Kodak set as the detection function varies. The values in bold are related to the best reconstruction of a specific image. In the last line there are the means of the MSE obtained in the reconstruction of the Kodak sample images, as the detection function varies. Note that the best result can be obtained by different detection functions, but, if one takes the means, then the minimal error corresponds to the detection function ϕ4. To evaluate whether the function ϕ4 is actually the best detection function, we proceed as follows. For each sample image we give five points to the detection function which allows to obtain an estimate with the minimal error; four points to the detection function which obtain the second best minimal error; three points in correspondence with the third minimal error, and so on.
| Image | ϕ1 | ϕ2 | ϕ3 | ϕ4 | ϕ5 | ϕ6 |
|---|---|---|---|---|---|---|
| 01 | 10.02 | 16.86 | 13.68 | 9.77 | 9.75 | 9.75 |
| 02 | 6.96 | 8.66 | 7.63 | 6.91 | 6.91 | 6.92 |
| 03 | 4.22 | 6.01 | 4.95 | 4.14 | 4.13 | 4.12 |
| 04 | 6.16 | 9.15 | 6.66 | 6.17 | 6.18 | 6.21 |
| 05 | 13.41 | 22.46 | 15.05 | 13.36 | 13.39 | 13.44 |
| 06 | 9.29 | 13.12 | 11.76 | 9.10 | 9.09 | 9.08 |
| 07 | 5.05 | 8.10 | 5.77 | 5.04 | 5.05 | 5.07 |
| 08 | 20.63 | 26.39 | 27.39 | 19.99 | 19.87 | 19.83 |
| 09 | 4.60 | 7.28 | 5.68 | 4.63 | 4.66 | 4.69 |
| 10 | 4.82 | 6.94 | 5.82 | 4.79 | 4.80 | 4.81 |
| 11 | 7.79 | 11.17 | 8.99 | 7.70 | 7.70 | 7.71 |
| 12 | 3.88 | 5.81 | 5.41 | 3.83 | 3.84 | 3.85 |
| 13 | 19.05 | 29.38 | 20.47 | 19.11 | 19.19 | 19.27 |
| 14 | 15.96 | 22.12 | 17.59 | 15.79 | 15.77 | 15.77 |
| 15 | 8.77 | 11.77 | 10.29 | 8.68 | 8.69 | 8.71 |
| 16 | 4.26 | 5.36 | 5.32 | 4.11 | 4.08 | 4.06 |
| 17 | 5.50 | 7.83 | 6.00 | 5.52 | 5.54 | 5.57 |
| 18 | 14.88 | 21.30 | 15.36 | 15.00 | 15.04 | 15.09 |
| 19 | 8.68 | 11.36 | 11.24 | 8.48 | 8.47 | 8.46 |
| 20 | 6.71 | 8.24 | 8.75 | 6.43 | 6.39 | 6.36 |
| 21 | 8.14 | 12.32 | 9.41 | 8.06 | 8.07 | 8.08 |
| 22 | 12.12 | 16.09 | 12.93 | 12.09 | 12.11 | 12.13 |
| 23 | 3.82 | 6.17 | 4.02 | 3.85 | 3.87 | 3.89 |
| Mean | 8.9002 | 12.7781 | 10.4428 | 8.8074 | 8.8080 | 8.8202 |
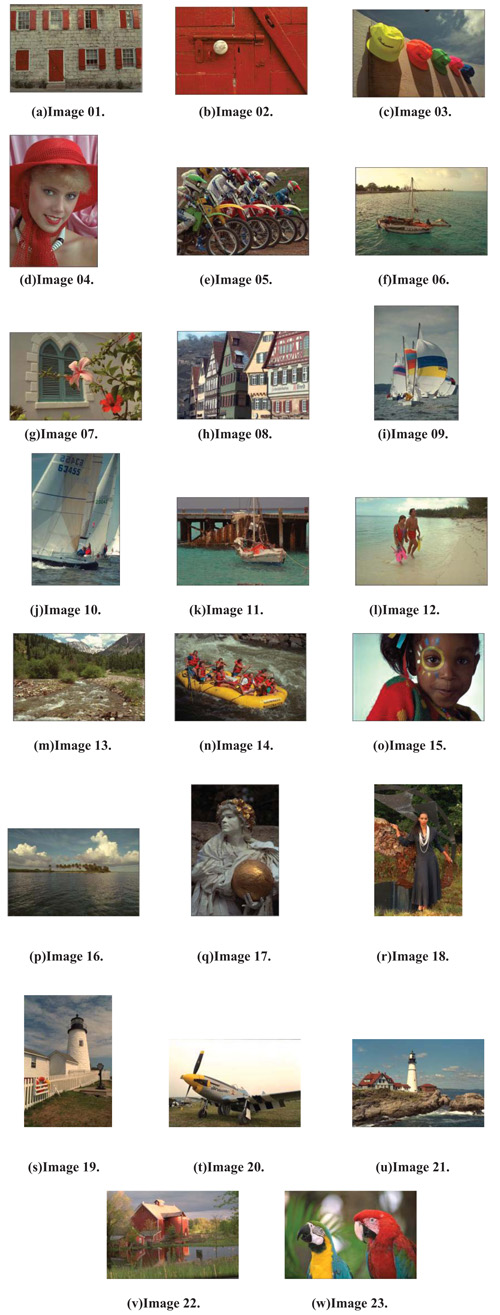 |
Fig. (5). Kodak image set. |
In Table 2 there are the results obtained by the all detection functions on the single images, and in the last line there is the global score. Observe that, even in this case, the highest score is obtained by the detection function ϕ4.
From now on, we use the detection function ϕ4 in the LEP algorithm. In Fig. (6a) the reconstruction of Image 02 is shown. If we evaluate the results visually, it is very difficult to perceive the errors present during the reconstruction. Thus, in Fig. (6b) we present the image of errors, which is given by
| Image | ϕ1 | ϕ2 | ϕ3 | ϕ4 | ϕ5 | ϕ6 |
|---|---|---|---|---|---|---|
| 01 | 2 | 0 | 1 | 3 | 4 | 5 |
| 02 | 2 | 0 | 1 | 4 | 5 | 3 |
| 03 | 2 | 0 | 1 | 3 | 4 | 5 |
| 04 | 5 | 0 | 1 | 4 | 3 | 2 |
| 05 | 3 | 0 | 1 | 5 | 4 | 2 |
| 06 | 2 | 0 | 1 | 3 | 4 | 5 |
| 07 | 4 | 0 | 1 | 5 | 3 | 2 |
| 08 | 2 | 1 | 0 | 4 | 3 | 5 |
| 09 | 5 | 0 | 1 | 4 | 3 | 2 |
| 10 | 2 | 0 | 1 | 5 | 4 | 3 |
| 11 | 2 | 0 | 1 | 4 | 5 | 3 |
| 12 | 2 | 0 | 1 | 5 | 4 | 3 |
| 13 | 5 | 0 | 1 | 4 | 3 | 2 |
| 14 | 2 | 0 | 1 | 3 | 5 | 4 |
| 15 | 2 | 0 | 1 | 5 | 4 | 3 |
| 16 | 2 | 0 | 1 | 3 | 4 | 5 |
| 17 | 5 | 0 | 1 | 4 | 3 | 2 |
| 18 | 5 | 0 | 1 | 4 | 3 | 2 |
| 19 | 2 | 0 | 1 | 3 | 4 | 5 |
| 20 | 2 | 1 | 0 | 3 | 4 | 5 |
| 21 | 2 | 0 | 1 | 5 | 4 | 3 |
| 22 | 3 | 0 | 1 | 5 | 4 | 2 |
| 23 | 5 | 0 | 1 | 4 | 3 | 2 |
| total | 68 | 2 | 21 | 92 | 87 | 75 |
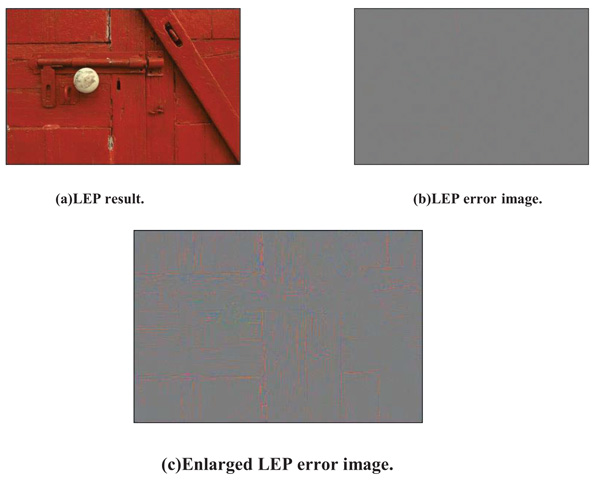 |
Fig. (6). LEP reconstruction of Figure 02. |
 |
where  is the estimate obtained by the LEP algorithm, x is the ideal image and e is the column vector belonging to
  , whose entries are equal to one. Again, it is difficult to note visually the errors of the algorithm. So, in Fig. (6c) we show the image of the enlarged errors, that is
 |
where it is possible to see in detail the errors of the algorithm.
Since most algorithms existing in the literature do not allow to see easily the errors related to the reconstructions, because they seem to be perfect, then, to compare our algorithm with some of those proposed in the literature, we use the table of the errors in the reconstruction of the Kodak dataset. In Tables 3 and 4, we compare the LEP method with the original Freeman filter [10] and with some other recently published algorithms [8, 12, 19, 22, 26-33]. Although the proposed algorithm gives the best reconstruction of two images, the total mean of the errors obtained with the LEP algorithm is the smallest of the selected methods.
| Image | [31] | [29] | [32] | [27] | [12] | [33] | [30] |
|---|---|---|---|---|---|---|---|
| 01 | 22.24 | 9.57 | 155.63 | 28.45 | 27.04 | 14.90 | 16.64 |
| 02 | 7.78 | 6.58 | 32.00 | 8.19 | 8.42 | 7.02 | 6.97 |
| 03 | 4.96 | 4.96 | 23.34 | 5.80 | 5.32 | 4.33 | 5.17 |
| 04 | 9.06 | 7.21 | 29.31 | 9.19 | 7.41 | 7.25 | 7.06 |
| 05 | 19.41 | 14.62 | 145.24 | 21.58 | 19.23 | 12.48 | 15.78 |
| 06 | 10.62 | 8.04 | 111.45 | 21.58 | 20.80 | 8.45 | 13.15 |
| 07 | 4.72 | 4.60 | 29.86 | 5.36 | 5.74 | 4.62 | 5.13 |
| 08 | 51.18 | 16.83 | 297.91 | 40.65 | 57.69 | 23.18 | 30.14 |
| 09 | 4.85 | 4.16 | 39.54 | 6.28 | 7.21 | 4.11 | 5.50 |
| 10 | 5.94 | 4.30 | 37.59 | 6.75 | 6.07 | 4.35 | 5.01 |
| 11 | 11.78 | 8.34 | 82.62 | 16.45 | 15.46 | 9.04 | 10.09 |
| 12 | 3.83 | 3.77 | 30.63 | 5.76 | 6.47 | 3.57 | 5.01 |
| 13 | 50.71 | 20.99 | 271.69 | 70.48 | 47.87 | 33.74 | 28.12 |
| 14 | 17.99 | 22.97 | 80.92 | 18.62 | 18.62 | 18.58 | 18.24 |
| 15 | 10.87 | 8.24 | 32.29 | 11.27 | 8.30 | 8.32 | 8.02 |
| 16 | 4.28 | 4.50 | 50.13 | 9.55 | 10.52 | 3.47 | 6.30 |
| 17 | 8.07 | 5.20 | 42.96 | 9.66 | 7.71 | 5.81 | 5.88 |
| 18 | 19.28 | 12.19 | 96.18 | 23.72 | 17.14 | 15.07 | 12.94 |
| 19 | 10.16 | 6.56 | 106.93 | 12.19 | 19.23 | 7.23 | 11.86 |
| 20 | 8.09 | 5.79 | 45.93 | 9.23 | 8.77 | 6.43 | 6.37 |
| 21 | 15.53 | 8.32 | 94.42 | 19.96 | 17.42 | 11.94 | 11.25 |
| 22 | 14.59 | 11.12 | 62.96 | 15.74 | 14.73 | 12.80 | 12.74 |
| 23 | 4.78 | 4.31 | 21.38 | 4.40 | 4.42 | 3.96 | 4.48 |
| mean | 13.9441 | 8.8330 | 83.5177 | 16.5586 | 15.7222 | 10.0269 | 10.9497 |
| Image | [34] | [28] | [8] | [10] | [26] | [22] | [19] | LEP |
|---|---|---|---|---|---|---|---|---|
| 01 | 10.77 | 19.77 | 35.65 | 53.34 | 17.74 | 15.31 | 11.04 | 9.77 |
| 02 | 8.96 | 7.57 | 36.48 | 11.69 | 14.69 | 6.14 | 7.81 | 6.91 |
| 03 | 12.16 | 4.58 | 37.25 | 8.57 | 12.25 | 3.52 | 4.64 | 4.13 |
| 04 | 5.11 | 8.43 | 36.74 | 10.04 | 13.78 | 4.93 | 6.59 | 6.17 |
| 05 | 10.52 | 17.50 | 35.49 | 39.02 | 18.54 | 11.94 | 11.49 | 13.56 |
| 06 | 8.77 | 11.43 | 36.40 | 37.33 | 14.93 | 8.77 | 10.69 | 9.10 |
| 07 | 4.51 | 5.32 | 37.08 | 10.05 | 12.77 | 3.61 | 4.54 | 5.04 |
| 08 | 22.81 | 27.11 | 34.60 | 96.56 | 22.60 | 22.80 | 19.99 | 19.99 |
| 09 | 7.74 | 5.05 | 37.42 | 13.06 | 11.67 | 4.05 | 4.30 | 4.63 |
| 10 | 3.86 | 5.45 | 37.25 | 12.29 | 12.22 | 4.05 | 4.34 | 4.79 |
| 11 | 7.78 | 11.62 | 36.40 | 24.57 | 14.86 | 8.26 | 7.59 | 7.70 |
| 12 | 2.91 | 4.29 | 37.59 | 12.90 | 11.41 | 3.36 | 4.80 | 3.83 |
| 13 | 24.78 | 47.00 | 33.66 | 77.41 | 27.87 | 35.90 | 24.38 | 19.11 |
| 14 | 15.35 | 18.33 | 35.08 | 26.53 | 20.23 | 11.33 | 16.42 | 15.79 |
| 15 | 7.64 | 10.26 | 36.23 | 16.74 | 15.53 | 8.38 | 8.72 | 8.68 |
| 16 | 3.53 | 4.74 | 37.50 | 16.61 | 11.48 | 3.59 | 4.23 | 4.11 |
| 17 | 4.99 | 7.73 | 41.12 | 13.28 | 5.06 | 5.31 | 4.90 | 5.52 |
| 18 | 12.83 | 19.64 | 35.98 | 34.73 | 16.41 | 16.79 | 13.24 | 15.00 |
| 19 | 6.28 | 9.31 | 40.19 | 34.55 | 6.21 | 7.20 | 6.83 | 8.48 |
| 20 | 5.51 | 7.76 | 32.52 | 22.11 | 3.67 | 6.10 | 5.80 | 6.43 |
| 21 | 9.23 | 14.36 | 36.48 | 29.09 | 14.66 | 10.74 | 8.37 | 8.06 |
| 22 | 9.40 | 14.69 | 37.33 | 21.57 | 12.05 | 9.42 | 10.33 | 12.09 |
| 23 | 8.67 | 4.22 | 39.45 | 6.97 | 7.38 | 3.06 | 4.07 | 3 85 |
| mean | 9.13 | 12.4412 | 36.6901 | 26.9135 | 15.2602 | 9.32 | 8.9175 | 8.8074 |
In the literature there exist several other algorithms, for instance that proposed [20], which is one of the best performed algorithms, obtaining a MSE mean equal to 6.11. However, in order to reach this goal, the needed mean computation time is equal to 27 minutes and 4 seconds, while the mean computation time for the LEP algorithm is equal to 0.16 seconds. The aim of the LEP algorithm is to obtain good results in a very short period of time. This method can be used as an initialization algorithm for the technique proposed [20], obtaining meaningful reductions of its computational cost.
In Fig. (7a) the reconstruction of Image 08 by LEP is presented. Its MSE, between the original Image 08 is about 19.99, obtained in a computational time of 0.16 seconds. The relative enlarged error image is presented in Fig. (7b). In Fig. (7c) the reconstruction of Image 08 by the algorithm proposed [20] is illustrated. Its MSE between the original Image 08 is about 12.33, obtained in a computational time of 27 minutes and 54.74 seconds. The relative enlarged error image is given in Fig. (7d). From the enlarged error images it is possible to notice how the algorithm proposed specially refines the reconstruction of the buildings on the left part of the image [20], however it does not allow an immediate processing of the image.
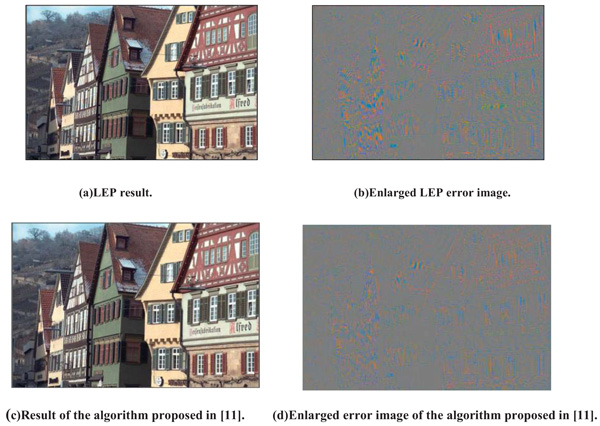 |
Fig. (7). Reconstruction of Image 08. |
CONCLUSION
We investigated the demosaicing problem and proposed a heuristic technique, in order to obtain a very fast algorithm. In particular, we proposed an algorithm consisting of three steps. In the first one, the green channel was updated by means of an edge-directed and weighted average technique. In the second one, the red and blue channels were updated, by using also the constraint of equality of the second derivatives in the various channels. In the third step, we proposed an iterative algorithm, assuming the constant color difference. this choice allowed to obtain accurate reconstructions in very short calculation times. Moreover, similarly as in the Freeman technique, in this phase we employed a median filter. We fixed a maximum number of iterative steps as four, in order to obtain low computational costs. We called our algorithm Local Edge Preserving (LEP).
The choice to impose an edge-preserving reconstruction, to impose a correlation between the channels on the derivatives of the second order, and to impose that the difference between the channels is constant, was the result of an extensive experimentation. Such an experimentation showed how this choice allowed to obtain accurate reconstructions in very short calculation times. Thus the proposed technique turns out to be very competitive when compared with some other methods known in the literature also [8, 12, 19, 22, 26-33].
CONSENT FOR PUBLICATION
Not applicable.
CONFLICT OF INTEREST
The authors declare no conflict of interest, financial or otherwise.
ACKNOWLEDGEMENTS
The first author was partially supported by the G. N. A. M. P. A. (the Italian National Group of Mathematical Analysis, Probability and Applications). The second and the third author were partially supported by the G. N. C. S. (the Italian National Group for the Scientific Computations).
This research was partially supported by the projects “Ricerca di Base 2017” (Metodi di Teoria dell'Approssimazione e di Analisi Reale per problemi di approssimazione ed applicazioni) and “Ricerca di Base 2018” (Metodi di Teoria dell'Approssimazione, Analisi Reale, Analisi Nonlineare e loro applicazioni).
REFERENCES
| [1] | Bai C, Lin Z, Yu J, Chen YW, Chen YW. Penrose demosaicking. IEEE Trans Image Process 2015; 24(5): 1672-84. |
| [2] | Hamilton JF, Compton JT. Processing color and panchromatic pixels. Patent US 0024879 2007. |
| [3] | Hirakawa K, Wolfe P. Spatio-spectral color filter array design for enhanced image fidelity. Image Processing (ICIP) 2007; 81-4. |
| [4] | Bayer BE. Color imaging array. Patent US 3971065 1976. |
| [5] | Hibbard RH. Apparatus and method for adaptively interpolating a full color image utilizing luminance gradients. Patent US 5382976 1995. |
| [6] | Laroche CA, Prescott MA. Apparatus and method for adaptively interpolating a full color image utilizing chrominance gradients. Patent US 537332 1994. |
| [7] | Kakarala R, Baharav Z. Adaptive demosaicking with the principal vector method. IEEE Trans Consum Electron 2002; 48: 932-7. |
| [8] | Buades A, Coll B, Morel JM, Sbert C. Self-similarity driven color demosaicking. IEEE Trans Image Process 2009; 18(6): 1192-202. |
| [9] | Adams JE. Interactions between color plane interpolation and other image processing functions in electronic photography. Proc SPIE 1995; 2416: 144-51. |
| [10] | Freeman W T. Median filter for reconstructing missing color samples. Patent US 4774565 1988. |
| [11] | Kimmel R. Demosaicing: image reconstruction from color CCD samples. IEEE Trans Image Process 1999; 8(9): 1221-8. |
| [12] | Pei SC, Tam IK. Effective color interpolation in CCD color filter arrays using signal correlation. IEEE Trans Circ Syst Video Tech 2003; 13: 503-13. |
| [13] | Tao B, Tastl I, Cooper T, Blasgen M, Edwards E. Demosaicing using human visual properties and wavelet interpolation filtering. Proceedings of Color Imaging Conference: Color Science, Systems, Applications 1999; 252-6. |
| [14] | Weldy JA. Optimized design for a single-sensor color electronic camera system. Proc SPIE 1988; 1071: 300-7. |
| [15] | Lu W, Tan YP. Color filter array demosaicking: New method and performance measures. IEEE Trans Image Process 2003; 12(10): 1194-210. |
| [16] | Wu X, Choi WK, Bao P. Color restoration from digital camera data by pattern matching. Proc SPIE 1997; 3018: 12-7. |
| [17] | Tsai PS, Acharya T, Ray AK. Adaptive fuzzy color interpolation. J Electron Imaging 2002; 11: 293-305. |
| [18] | Adams JE, Hamilton JF. Design of practical color filter array interpolation algorithms for digital cameras. Proc SPIE 1997; 3028: 117-25. |
| [19] | Gunturk BK, Altunbasak Y, Mersereau RM. Color plane interpolation using alternating projections. IEEE Trans Image Process 2002; 11(9): 997-1013. |
| [20] | Gerace I, Martinelli F, Tonazzini A. Demosaicing of noisy color images through edge-preserving regularization. Proceeding of 2014 International Workshop on Computational Intelligence for Multimedia Understanding (IWCIM) 2014; 1-5. |
| [21] | Menon D, Calvagno G. Regularization approaches to demosaicking. IEEE Trans Image Process 2009; 18(10): 2209-20. |
| [22] | Kiku D, Monno Y, Tanaka M, Okutomi M. Beyond color difference: Residual interpolation for color image demosaicking. IEEE Trans Image Process 2016; 25(3): 1288-300. |
| [23] | Hadamard J. Lectures on cauchy’s Problem in linear partial differential equations Yale 1923. |
| [24] | Kodak lossless true color image suiter. Available on: http:// r0k. us/ graphics/ kodak/ |
| [25] | Hosam O. Side-informed image watermarking scheme based on dither modulation in the frequency domain. Open Signal Process J 2013; 5: 1-6. |
| [26] | Ferradans S, Bertalmío M, Caselles V. Geometry-based demosaicking. IEEE Trans Image Process 2009; 18(3): 665-70. |
| [27] | Hamilton JF, Adams JE. Adaptive color plane interpolation in single sensor color electronic camera. Patent US 5629734 1997. |
| [28] | Hirakawa K, Parks TW. Adaptive homogeneity-directed demosaicing algorithm. IEEE Trans Image Process 2005; 14(3): 360-9. |
| [29] | Li X. Demosaicing by successive approximation. IEEE Trans Image Process 2005; 14(3): 370-9. |
| [30] | Lukac R, Plataniotis KN. Data-adaptive filters for demosaicing: A framework. IEEE Trans Consum Electron 2005; 51: 560-70. |
| [31] | Muresan DD, Parks TW. Demosaicing using optimal recovery. IEEE Trans Image Process 2005; 14(2): 267-78. |
| [32] | Sakamoto T, Nakanishi C, Hase T. Software pixel interpolation for digital style camera suitable for a 32-bit MCU. IEEE Trans Consum Electron 1998; 44: 1342-52. |
| [33] | Wu X, Zhang N. Primary-consistent soft-decision color demosaicking for digital cameras (patent pending). IEEE Trans Image Process 2004; 13(9): 1263-74. |
| [34] | Moghadam AA, Aghagolzadeh M, Kumar M, Radha H. Compressive framework for demosaicing of natural images. IEEE Trans Image Process 2013; 22(6): 2356-71. |


